
Flow Control in Make-to-Order Manufacturing
21 October 2026High mix, low volume across the entire production flow
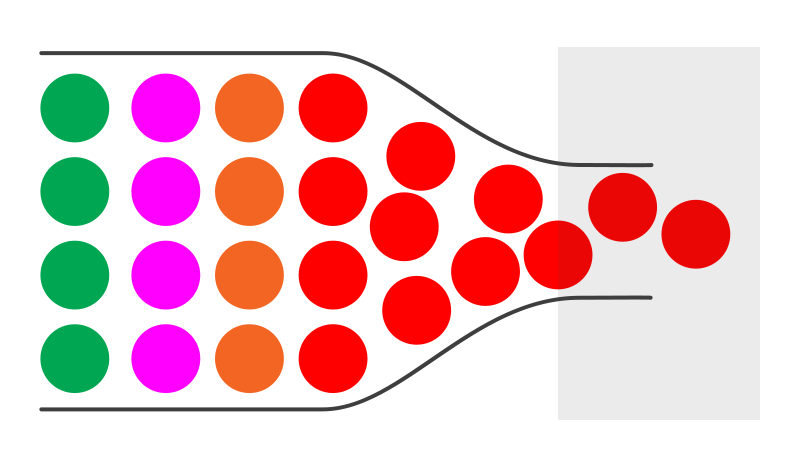
For European manufacturers, competing on cost alone is hard. In high-mix, low-volume production, a large part of the competitive advantage lies in the ability to respond to custom requests, adapt to customer needs and deliver with short and reliable lead times.
This requires looking at the entire production flow, following orders, batches and materials through processing steps, waiting times, inspections and handovers between departments. Equipment efficiency and machine utilization still matter, but on their own they don’t explain how long it takes to complete an order or a batch, where waiting time builds up, or why a delivery is at risk of slipping.
The shift involves four aspects. Even before technology, what changes is the way production is measured and decisions are made.
| Traditional approach | Flow-oriented approach |
|---|---|
| Mass production | High mix, low volume |
| Managing volumes | Managing variability |
| Efficiency of the single machine | Results of the whole factory |
| Cost per machine hour | Order lead time |
1. The context, and the end of predictable manufacturing
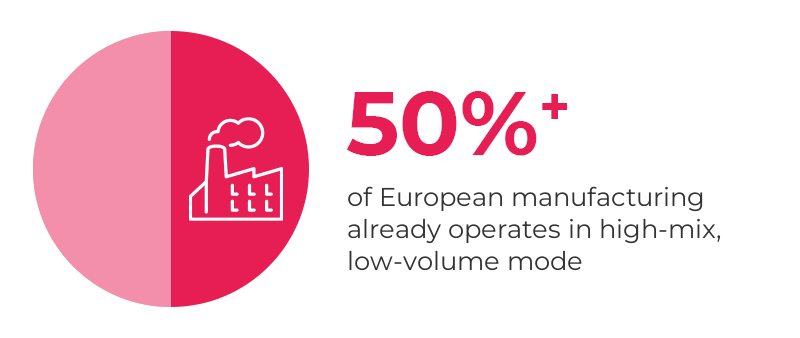
Many management models assume high volumes, standardized products, stable sequences and predictable demand. The reality of a high-mix, low-volume factory is different: many different products, small batches, variable routings and shifting priorities.
This complexity is often the result of a deliberate competitive choice: offering customers tailor-made products, handling changes even after an order is under way, and responding quickly to new requests.
This model can be found, for example, in some industrial machinery, aerospace components, measuring instruments and specialized equipment production, as well as in metal fabrication and small-batch machining. It doesn’t apply indiscriminately to entire industries: what matters is the actual combination of variety, volumes and production routings.
Each order may require different resources, in different sequences and with different constraints. Complexity grows when these routings cross and depend on one another.
An engineering change, a missing component or an inspection that takes longer than expected has consequences that also depend on the other orders in progress. A delay in one step can shift the planned workload in another department, create new waiting times and force priorities to be revised.
In this context, measuring machine utilization alone gives an incomplete picture. Bottlenecks can shift with the product mix, while standard times and schedules become less representative as variability increases.
Keeping every resource busy at all times can also have unwanted effects. Releasing more orders into production without considering the capacity of downstream steps risks increasing work in progress (WIP) and lengthening queues.
2. Why deliveries slip, and the misunderstanding of lean
One of the core principles of lean is improving flow by eliminating the waste that slows orders down as they move through the factory.
McKinsey reaffirmed this in a March 2025 article on high-complexity, low-volume manufacturing: practices that work in industries such as automotive and electronics should not be transferred automatically to factories with a different mix, variability and constraints. The goal is still to improve flow; the methods have to fit the context. [1]
In high-mix, low-volume production, a department can hit its efficiency and machine utilization targets without managing to complete the most urgent orders. A machine can be highly utilized while, elsewhere, semi-finished parts pile up waiting.
The misunderstanding arises when improving flow is reduced to a goal set at the level of individual machines: keep them busy at all times, increase their efficiency, avoid any downtime.
Little’s Law
Under stable conditions, average WIP equals the average output rate multiplied by the average lead time. At the same output rate, more work in the system means longer lead times. [2]
The operational consequence is familiar: the factory is working hard, but orders move forward slowly. To improve deliveries, you need to understand which activities move orders forward and which ones only feed new queues.
3. The real hidden cost is the order that sits still
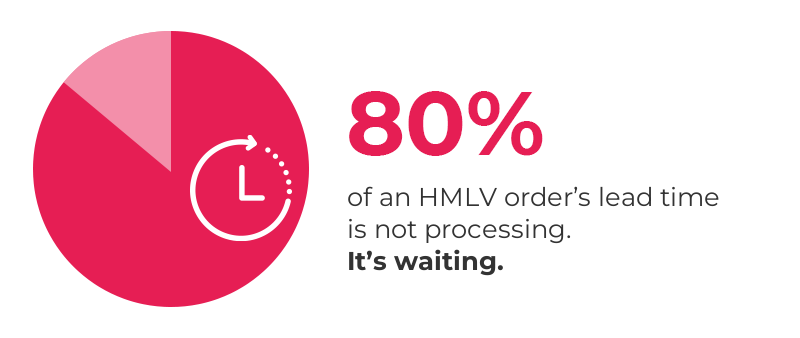
Lead time includes both processing and waiting. Measuring only the hours worked leaves part of the order’s journey out of the picture.
A component may wait in front of a machine, sit idle until a heat-treatment batch is complete, or wait for a design change or a quality inspection. These intervals can affect delivery without showing up in the recorded processing hours alone.
If data collection focuses on the start and end of operations, these steps remain largely invisible. Likewise, an ERP updated only after the fact makes it possible to reconstruct the outcome, but is less helpful in understanding where to act while work is still in progress.
Tied-up capital
Money already spent on materials and processing stays locked up in products not yet completed. Reducing waiting times can help reduce the capital absorbed by WIP.
Self-reinforcing variability
The longer an order stays in the system, the more exposed it can be to specification changes, new rush orders and rescheduling that complicate coordination.
Less reliable deliveries
Without an up-to-date view of progress, delay risks may surface when there is already little room left to recover.
That is why machine-level metrics need to be complemented by continuous measurement of the orders’ journey: where they are, how long they stay in each step, and what is preventing them from moving forward.
4. Three questions a factory should be able to answer
The actions that improve flow are well known. Applying them, however, requires information that is sufficiently up to date and shared. The starting point can be summed up in three questions.

1. Where are my orders right now?
Real-time visibility into the location and status of every order in the system.

2. Will they arrive on time?
Measuring the real cycle time, including waiting, not just processing.

3. What is slowing them down?
Identifying the active constraints: queues, waiting, decisions not yet made.
Where are my orders right now?
With many active orders and different routings, getting an overall picture becomes difficult. The production manager knows the main priorities, but to piece together the rest they may have to make phone calls, ask department heads or walk around the shop floor.
An up-to-date view of how orders are distributed makes it possible to spot accumulations and manage WIP by area. It also helps coordinate priorities beyond the boundaries of a single department. This is the job of production control: coordinating work across departments, like an air traffic control center.
Will they arrive on time?
This is the customer’s question, and it should be answered before the delivery turns into an emergency. Assessing it means looking at total lead time, including waiting, together with the steps still to be completed. Knowing that an order has been sitting still for days makes it possible to act before someone starts looking for it.
The data needs to follow the physical journey of orders and batches. Automatic data collection, where applicable, can make updates more timely and reduce reliance on manual reporting. Visibility doesn’t eliminate uncertainty, but it makes it possible to recognize the warning signs of delay earlier.
What is slowing them down?
Blockages can depend on machines, but also on handovers between departments and on support activities: a missing component, a technical approval, a quality inspection, a material handling move or an undefined priority. Identifying where the wait is and how long it lasts is the first step. The next is understanding its cause, assigning responsibility and clarifying when to act.
Daily operational meetings also become more useful if, alongside safety, quality and costs, they address concrete questions about flow: which orders are at risk? Where are queues growing? Which decision can unblock the work?
The three questions turn data collection into a management tool. The value lies in being able to recognize the problem and act while there is still time.
5. Managing time in day-to-day work
Quality management, lean and digitalization have brought essential tools for controlling processes, reducing waste and better understanding equipment. In complex production, these tools also need to help follow the order’s entire journey.
Quality management
Focus: process
Lean Manufacturing
Focus: waste
Digitalization
Focus: machine
Time management
Focus: order flow
Managing time means tracking lead times with the same attention given to quality and costs. It means assessing department performance also in terms of how orders and batches are completed, and managing changes in products, quantities and priorities every day.
The goal is a factory that can react earlier, keep waiting times under control and commit to more reliable delivery dates, even when customer requests or production priorities change.
How quickly, and how reliably, do orders move through our factory? This is where flow control can become a concrete lever for competitiveness.
Why Komete was founded
Komete was born from this very observation: many traditional production management systems focus on machine efficiency and hours worked, while make-to-order manufacturers have to answer a different question every day: will we deliver to the customer on the promised date?
That is why we chose to focus on the real flow of orders, including waiting times and handovers between departments, to help factories understand where their orders are, what is slowing them down and which ones are at risk of arriving late.
References
[1] McKinsey, How high-complexity, low-volume manufacturers can reach full potential, March 20, 2025.
https://www.mckinsey.com/capabilities/operations/our-insights/how-high-complexity-low-volume-manufacturers-can-reach-full-potential
[2] MIT, Manufacturing Processes and Systems, 2018.
https://web.mit.edu/course/2/2.810/www/files/lectures/lec1-intro-2018.pdf