
The hidden cost of producing many variants: coordinating the physical flow of batches. The case of the valve sector.
8 June 2026In factories that produce many variants in small batches, the real hidden cost is not the idle machine, but the idle order. The more codes, routings, and urgent jobs increase, the more the coordination cost grows non-linearly: a significant portion of lead time is not processing, but waiting, searching for information, and replanning. ERP and MES do not see the physical flow of batches and leave uncovered precisely the level where this cost is generated. A physical flow management system covers this gap, reducing manual coordination and freeing up delivery reliability, WIP, and production capacity. The application case is the industrial valve sector.
The production context of the valve sector
The industrial valve sector has characteristics that make it particularly complex to manage operationally. Most Italian companies in this segment work on order, with catalogs that can count several thousand active codes among finished products, variants, and spare parts. A single valve family can generate dozens of different configurations, each with its own production cycle.
This product complexity is matched by an equally significant process complexity. The typical production cycle goes through casting, machining on lathes and machining centers, heat and surface treatments, inspections, assembly, and testing. Many steps leave and re-enter the facility multiple times. Lead times are often long and the production mix combines repetitive orders with highly customized special jobs and frequent urgent requests.
In this context the most relevant operational problem is almost never production capacity in the strict sense. The problem is coordinating these order flows that follow distinct paths. The more variants, urgent jobs, and different routings increase, the more operational chaos grows in a non-linear way. And in many factories in the sector, a huge portion of time and resources is spent simply figuring out where the batches are, how far along they really are, what is stalled, what is missing, what is at risk of delay.
How the factory’s status is reconstructed today
The real status of orders is often reconstructed through phone calls, Excel files running parallel to the ERP, alignment meetings, messages between department heads, and physical walks through the shop floor to see things with one’s own eyes. The planner spends a significant portion of the day chasing information: calls the machining manager to find out if the bodies from the critical job have come out of grinding, asks the warehouse if the rods have returned from external treatment, opens three different Excel sheets to figure out what is truly ready for assembly.
The production manager walks the shop floor because they don’t fully trust the data in the system, and has learned that the only way to be sure is to go and look. Customer service receives the call from the client asking for a confirmed delivery date and has no reliable answer to give, so they forward the request to planning, which in turn has to start investigating. The daily operational meeting, the nine or ten o’clock one, often serves mainly to realign information that should theoretically already be available to everyone.
The result is that information is distributed in people’s heads, not in the system. No one has a truly up-to-date and complete view of the situation. And management discovers problems only when the delay is already evident, usually when the customer picks up the phone or when the sales team flags that the promised delivery is no longer sustainable. By that point, recovering costs far more than preventing.
“In high-variability manufacturing, the real hidden cost is not the idle machine — it’s the idle order.”
Why ERP and MES alone don’t solve the problem
It is a legitimate question: in many of these companies the ERP has been in place for years, and in several a MES has also been introduced on the main machines. So why does real visibility remain lacking? The reason is structural. The ERP records declared progress, not physical flows. It knows that a phase has been closed in the system, but does not know where the batch is physically at that moment, nor how long it has been waiting for the next phase. Progress declarations, when manual, often arrive at the end of the shift or end of the day, and in the meantime the system’s picture is out of sync with reality. The MES, for its part, monitors machine status: whether it is working, in setup, or stopped. It answers the question “is the machine producing?”, not “where is the batch getting stuck?”.
In high-mix low-volume production these two questions have very different answers. The waiting times between one phase and the next, the dwell times in intermediate buffers, the days spent waiting for a component to close an assembly, the weeks spent at external treatment suppliers with no real visibility on return: all of this remains essentially invisible to traditional systems. Yet this is precisely where most of the lead time is generated.
Where lead time is actually generated
| Lead time component | Typical share | Visible in the system? |
|---|---|---|
| Value-added time (actual processing) | 10–25% | Yes (MES) |
| Waiting between phases, queues, internal buffers | 30–45% | No |
| External treatments and handling | 15–25% | Partial |
| Searching for information, replanning, waiting for components | 15–25% | No |
When seriously measuring the time a job spends in the facility, from raw material intake to shipment, the value-added time — that is, the time when the part is actually being machined or assembled — typically represents a small fraction of the total. The rest is queuing, waiting for components, internal transport, searching for information, replanning. This is the invisible part where the real cost hides.
What each system answers
| Operational question | ERP | MES | Flow Mgmt System |
|---|---|---|---|
| Has the phase been declared closed? | Yes | Yes | Yes |
| Is the machine working? | No | Yes | Yes |
| Where is the batch physically right now? | No | No | Yes |
| How long has the batch been stalled? | No | No | Yes |
| Which orders are falling behind? | Only after the fact | No | Yes, with alerts |
| Real history of throughput times? | No | Partial | Yes |
What a physical flow management system actually does
A Flow Management System does not replace ERP and MES and has no intention of doing so. It covers the level that today in most valve factories is not covered by anyone: the real physical flow of batches, from raw material to shipment, including steps at subcontractors.
In operational terms this means several things. Automatic tracking and localization of batches via RTLS technologies, reducing dependence on manual declarations. Real-time visibility of the position and status of every job, accessible to planning, production, logistics, and customer service without needing to ask or call. A digital map of the production flow showing where batches are, how long they have been stalled at each point, and what the next scheduled phase is. Automatic identification of anomalous waiting times compared to historical data, which is very different from the standard times loaded into the system. Alerts on at-risk orders before the delay becomes a reality. A real history of movements, which finally makes it possible to analyze the true bottlenecks, which often do not match the perceived ones.
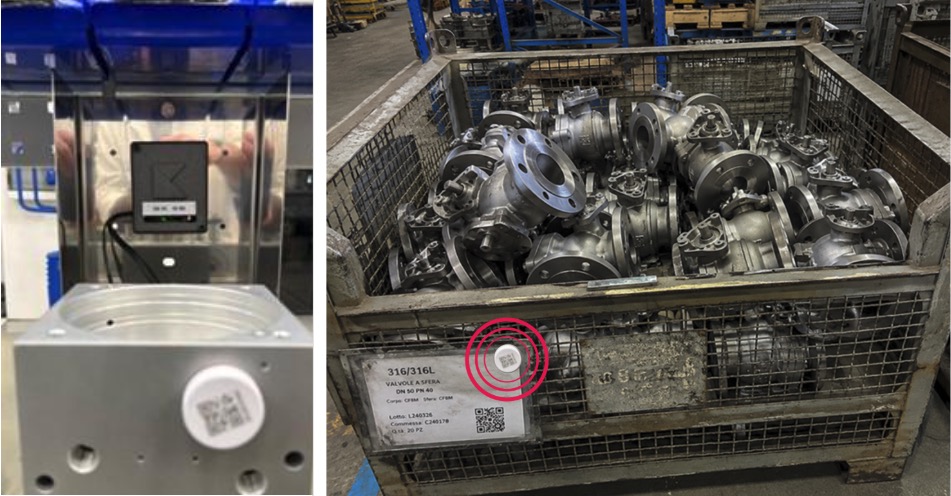
unique batch identification and automatic tracking, with no manual declarations.
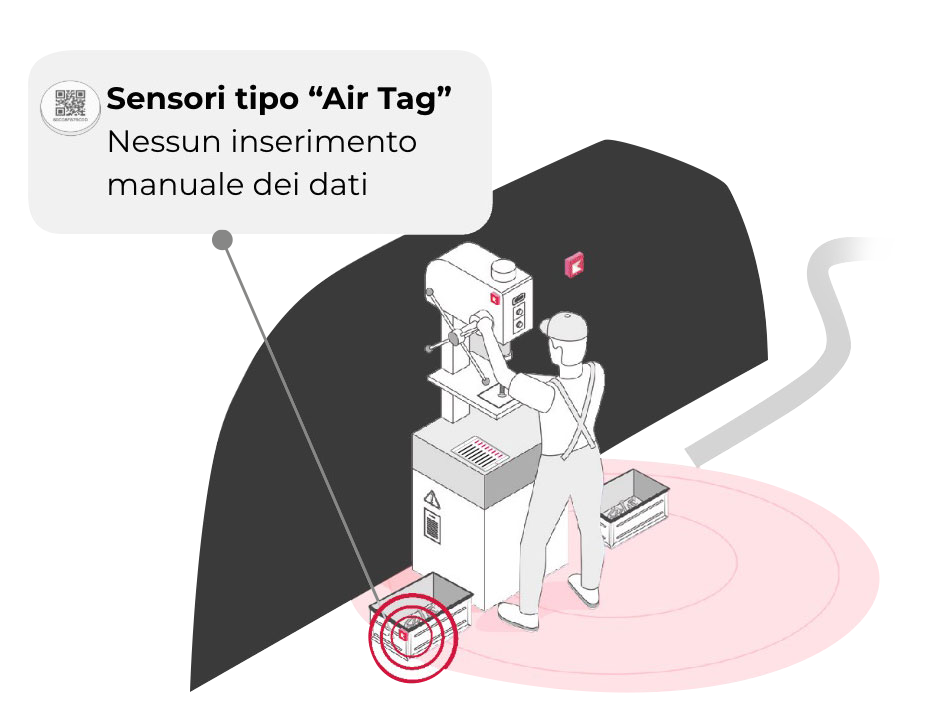
“Air Tag” type sensors detect batch movements between stations: no manual data entry required.
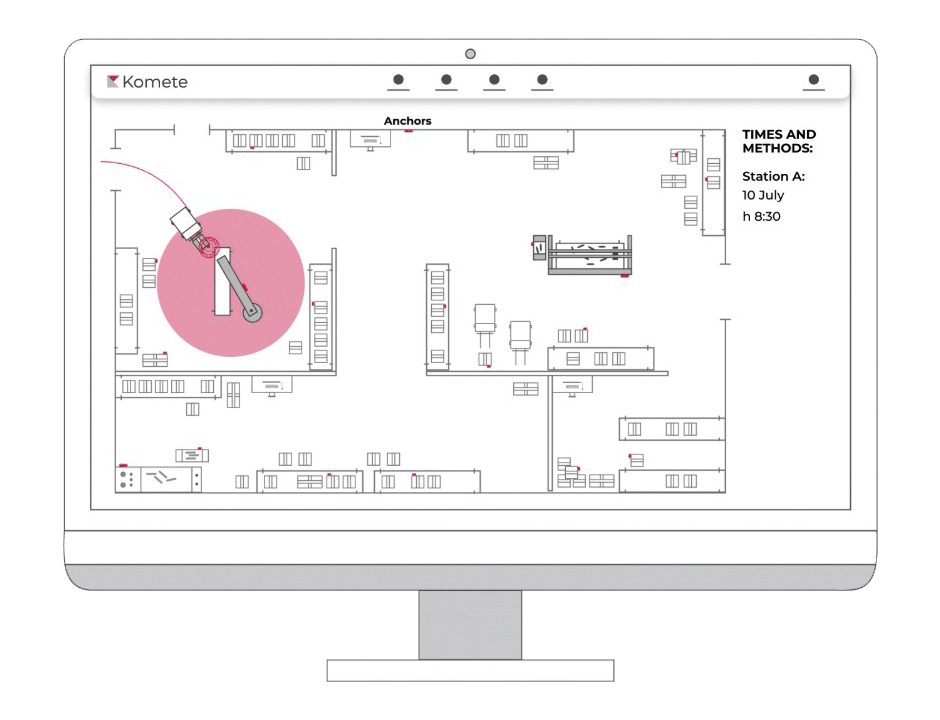
Digital map of the facility with real-time batch positions and dwell times per station.
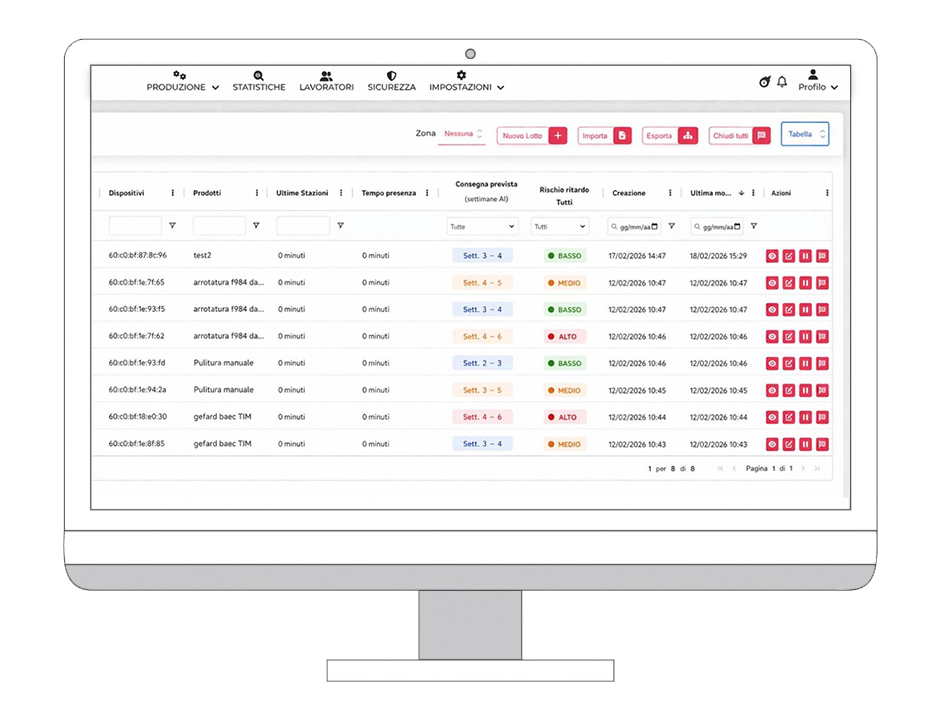
Batch view in production: status, last station, time on floor, expected delivery, and delay risk for each order.
Operational benefits and organizational impact
When the flow becomes reliably visible, the practical effects are concrete and measurable. The planner stops redoing the plan multiple times a day because they can see in advance what is slowing down and can act before the problem spreads. WIP is reduced, because it prevents pushing work into production that will then sit idle waiting for something. Delivery reliability improves, not because more work gets done, but because the response comes earlier and with accurate information. Customer service is able to respond to clients with reliable data, without having to launch an internal investigation every time.
The time spent on manual coordination is drastically reduced: fewer phone calls, fewer shop floor walks, fewer meetings that exist only to reconstruct the state of affairs. Operators are interrupted less and can focus on their work. Management shifts from a reactive management mode, in which problems are chased, to exception-based management, in which attention is focused only on the cases that truly require intervention.
Summary of benefits by area
| Area | What changes operationally | Expected impact |
|---|---|---|
| Planning | Fewer daily replanning cycles, earlier detection of slowdowns | Reduction in time spent replanning |
| Production | Fewer interruptions to operators, more stable flow | WIP reduction, capacity recovery |
| Customer Service | Confirmed answers to clients without internal chasing | Improved service quality |
| Internal Logistics | Less physical searching for pallets and components | Reduction in downtime |
| Management | Exception-based management instead of crisis management | Decisions based on real data |
| Capacity | Fewer orders needlessly stalled along the flow | Additional capacity without new machines |
The most significant economic benefit is probably the last one: production capacity is recovered without investment in new machines. Not because the equipment works more, but because orders stop sitting idle needlessly along the flow. In a sector like valves, where product and process complexity is set to increase, governing the physical flow is no longer a marginal efficiency topic: it is the prerequisite for staying competitive on delivery times and customer service.